Weekly Economic Update (Aug. 31- Sept. 4, 2026)

Download as a PDF
Embed Article
Copy
Weekly Economic Update (Aug. 31- Sept. 4, 2026)
Text LinkText Link
Quick snapshot of what this article covers:

Key Points

While energy components have been a key driver of inflation in recent months, core inflation (which excludes volatile food and energy components) remains concerning for monetary policymakers.‍

  • Labor intensive core non-housing services inflation has been particularly persistent.
  • However, average hourly earnings growth has continued to slow over 2026 supporting additional non-housing services disinflation.

Contribution to Core PCE Inflation
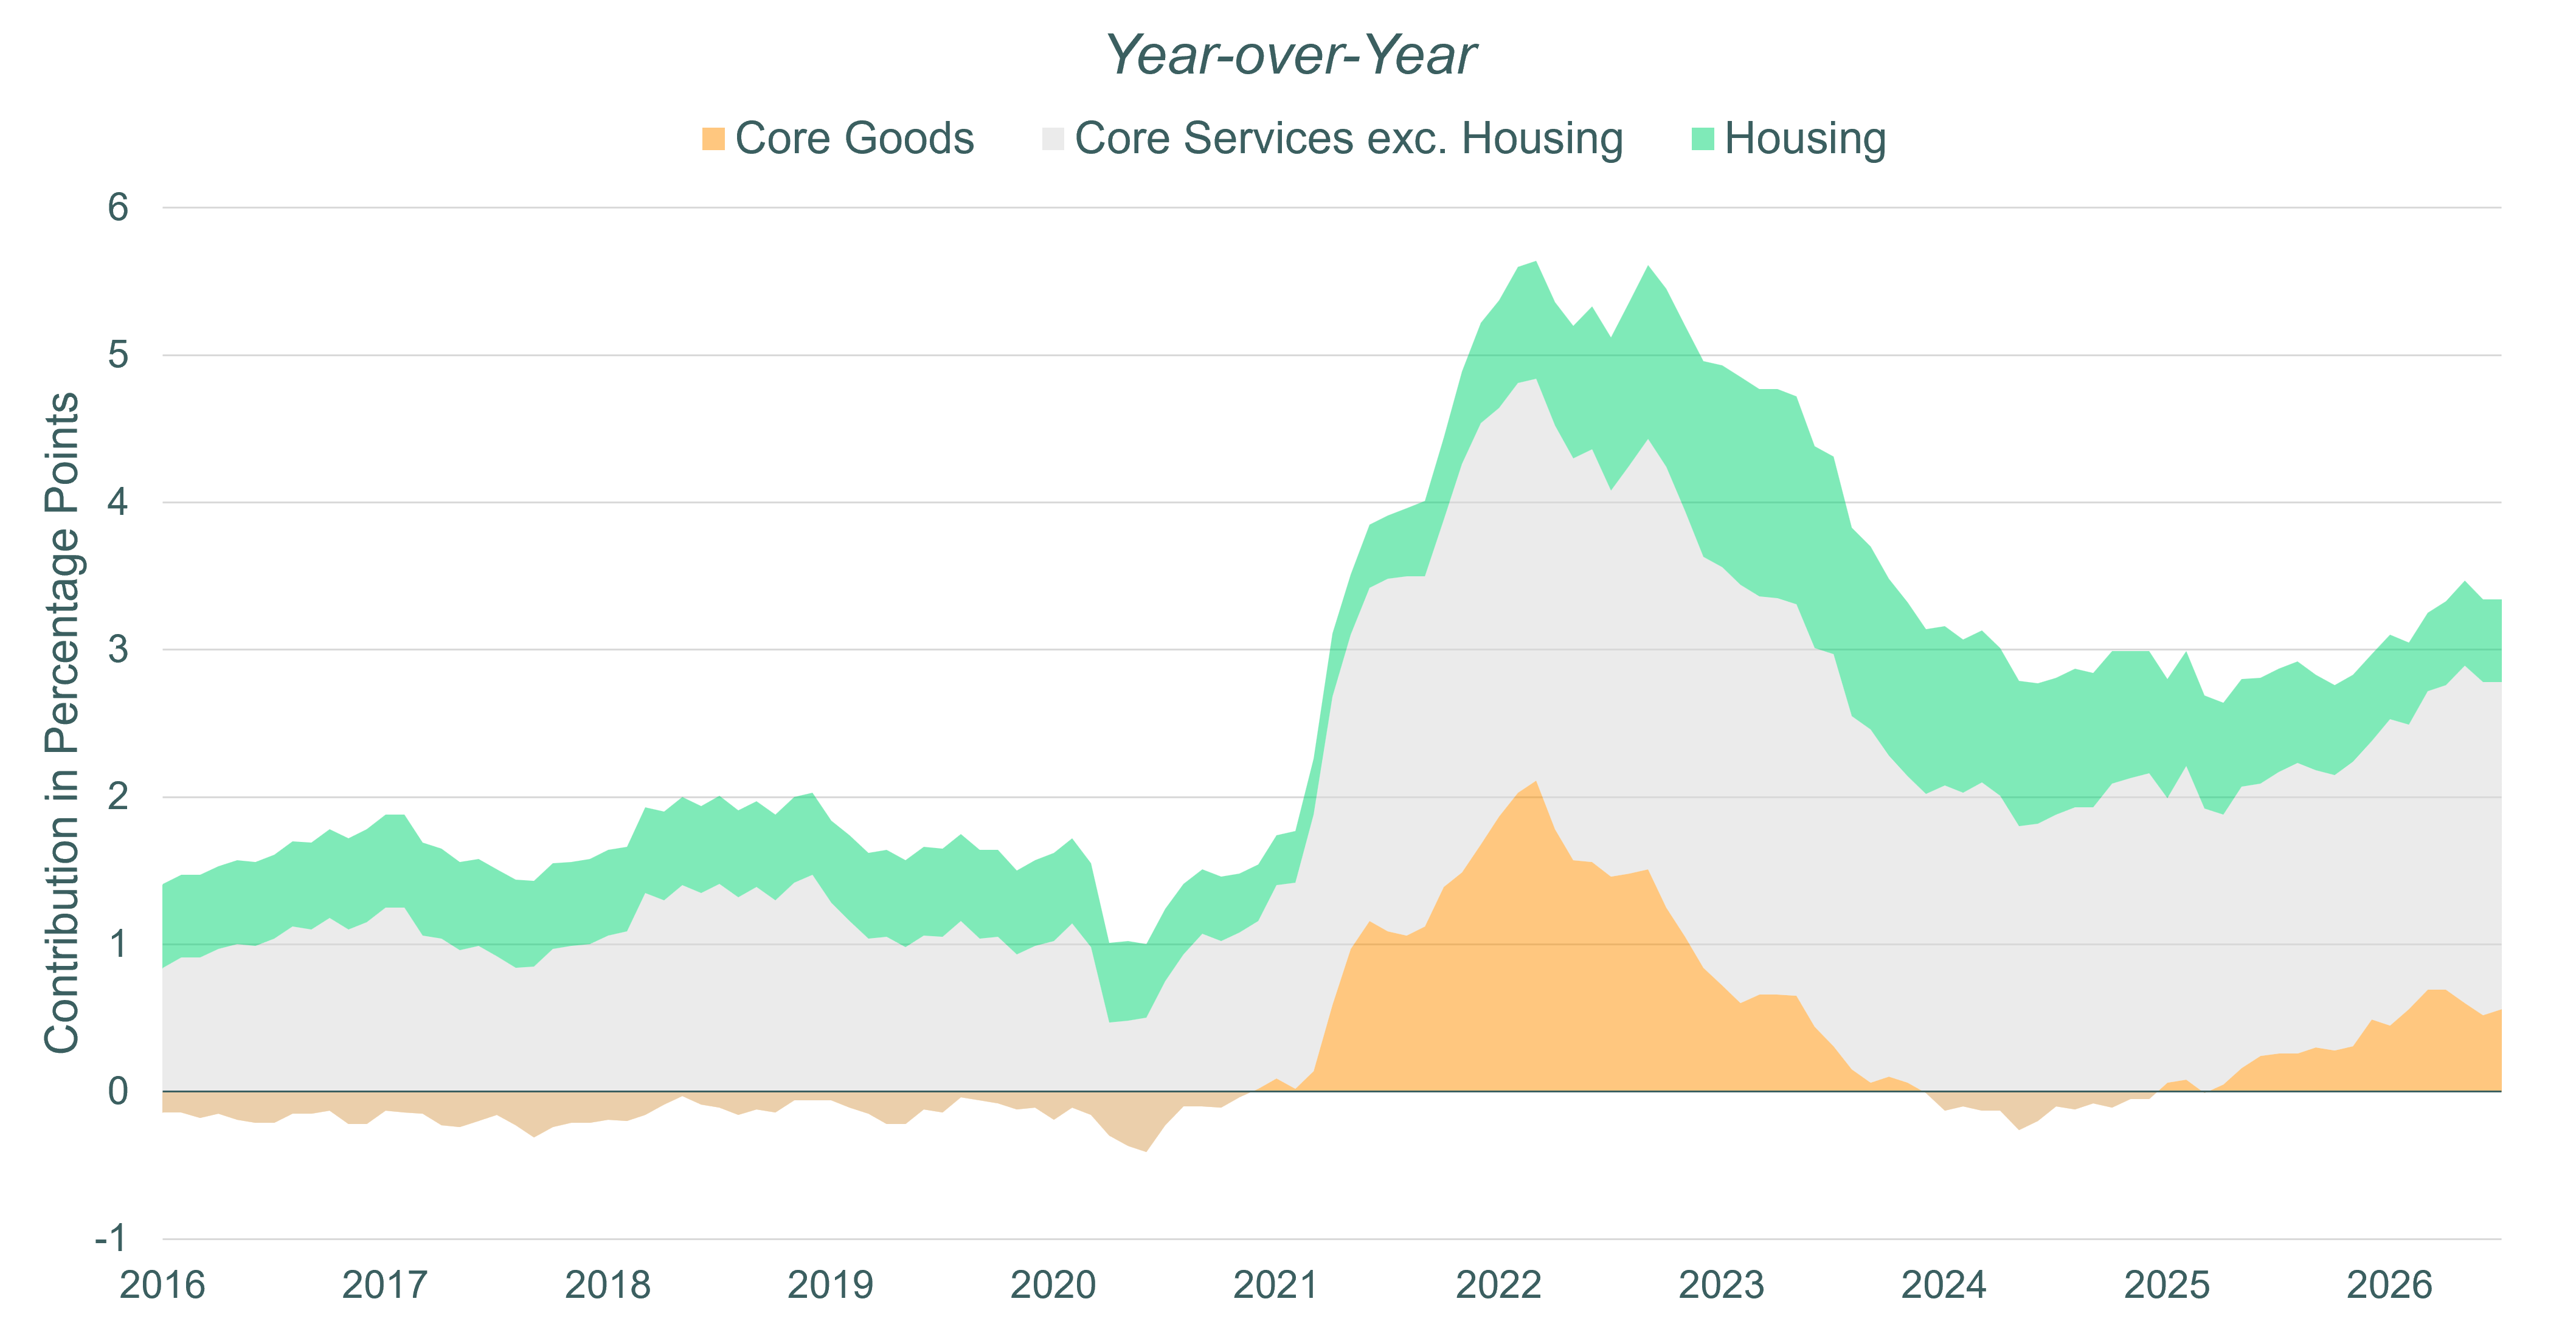
Source: U.S. Bureau of Economic Analysis

Average Hourly Earnings Growth: Total Private

Source: U.S. Bureau of Labor Statistics

‍

‍

The unemployment rate has fallen to 4.1% from a recent peak of 4.5% in November 2025, though the average duration of unemployment has risen.

  • The average duration of unemployment has risen by nearly 7 weeks since reaching its cyclical low in 2023.

Average Weeks Unemployed

Line graph showing average weeks unemployed in the US from 2016 to 2026, seasonally adjusted. The value starts around 29 weeks in 2016, declines to about 20 weeks by 2019, drops sharply to around 7 weeks in early 2020, then rises steeply to peak near 32 weeks in 2021 before declining gradually to about 20 weeks by 2023. From 2023 onwards, the trend shows a slight upward movement reaching approximately 26 weeks by 2026.
Source: U.S. Bureau of Labor Statistics
Share on Facebook
Share on LinkedIn
Embed Article
Copy
Embed Article

Get More Expert Insights Like This Right in Your Inbox

Get the best expertise and insights to help you navigate the mortgage and housing industries.

No spam, ever.  View our online privacy policy.