
Weekly Economic Update (Sep. 28-Oct.2, 2026)

Download as a PDF
Embed Article
Copy
Weekly Economic Update (Sep. 28-Oct.2, 2026)
Text LinkText Link
Quick snapshot of what this article covers:

Key Points

The unemployment rate rose by 0.1pp to 4.2% in September.

  • The small increase was related to rising labor force participation which reached the highest rate seen since May.
  • The number of unemployed workers citing permanent job loss or having left a job fell, but this was more than offset by an increase in unemployment reported by new entrants and re-entrants to the labor force.

Change in Unemployment by Reason, Seasonally Adjusted
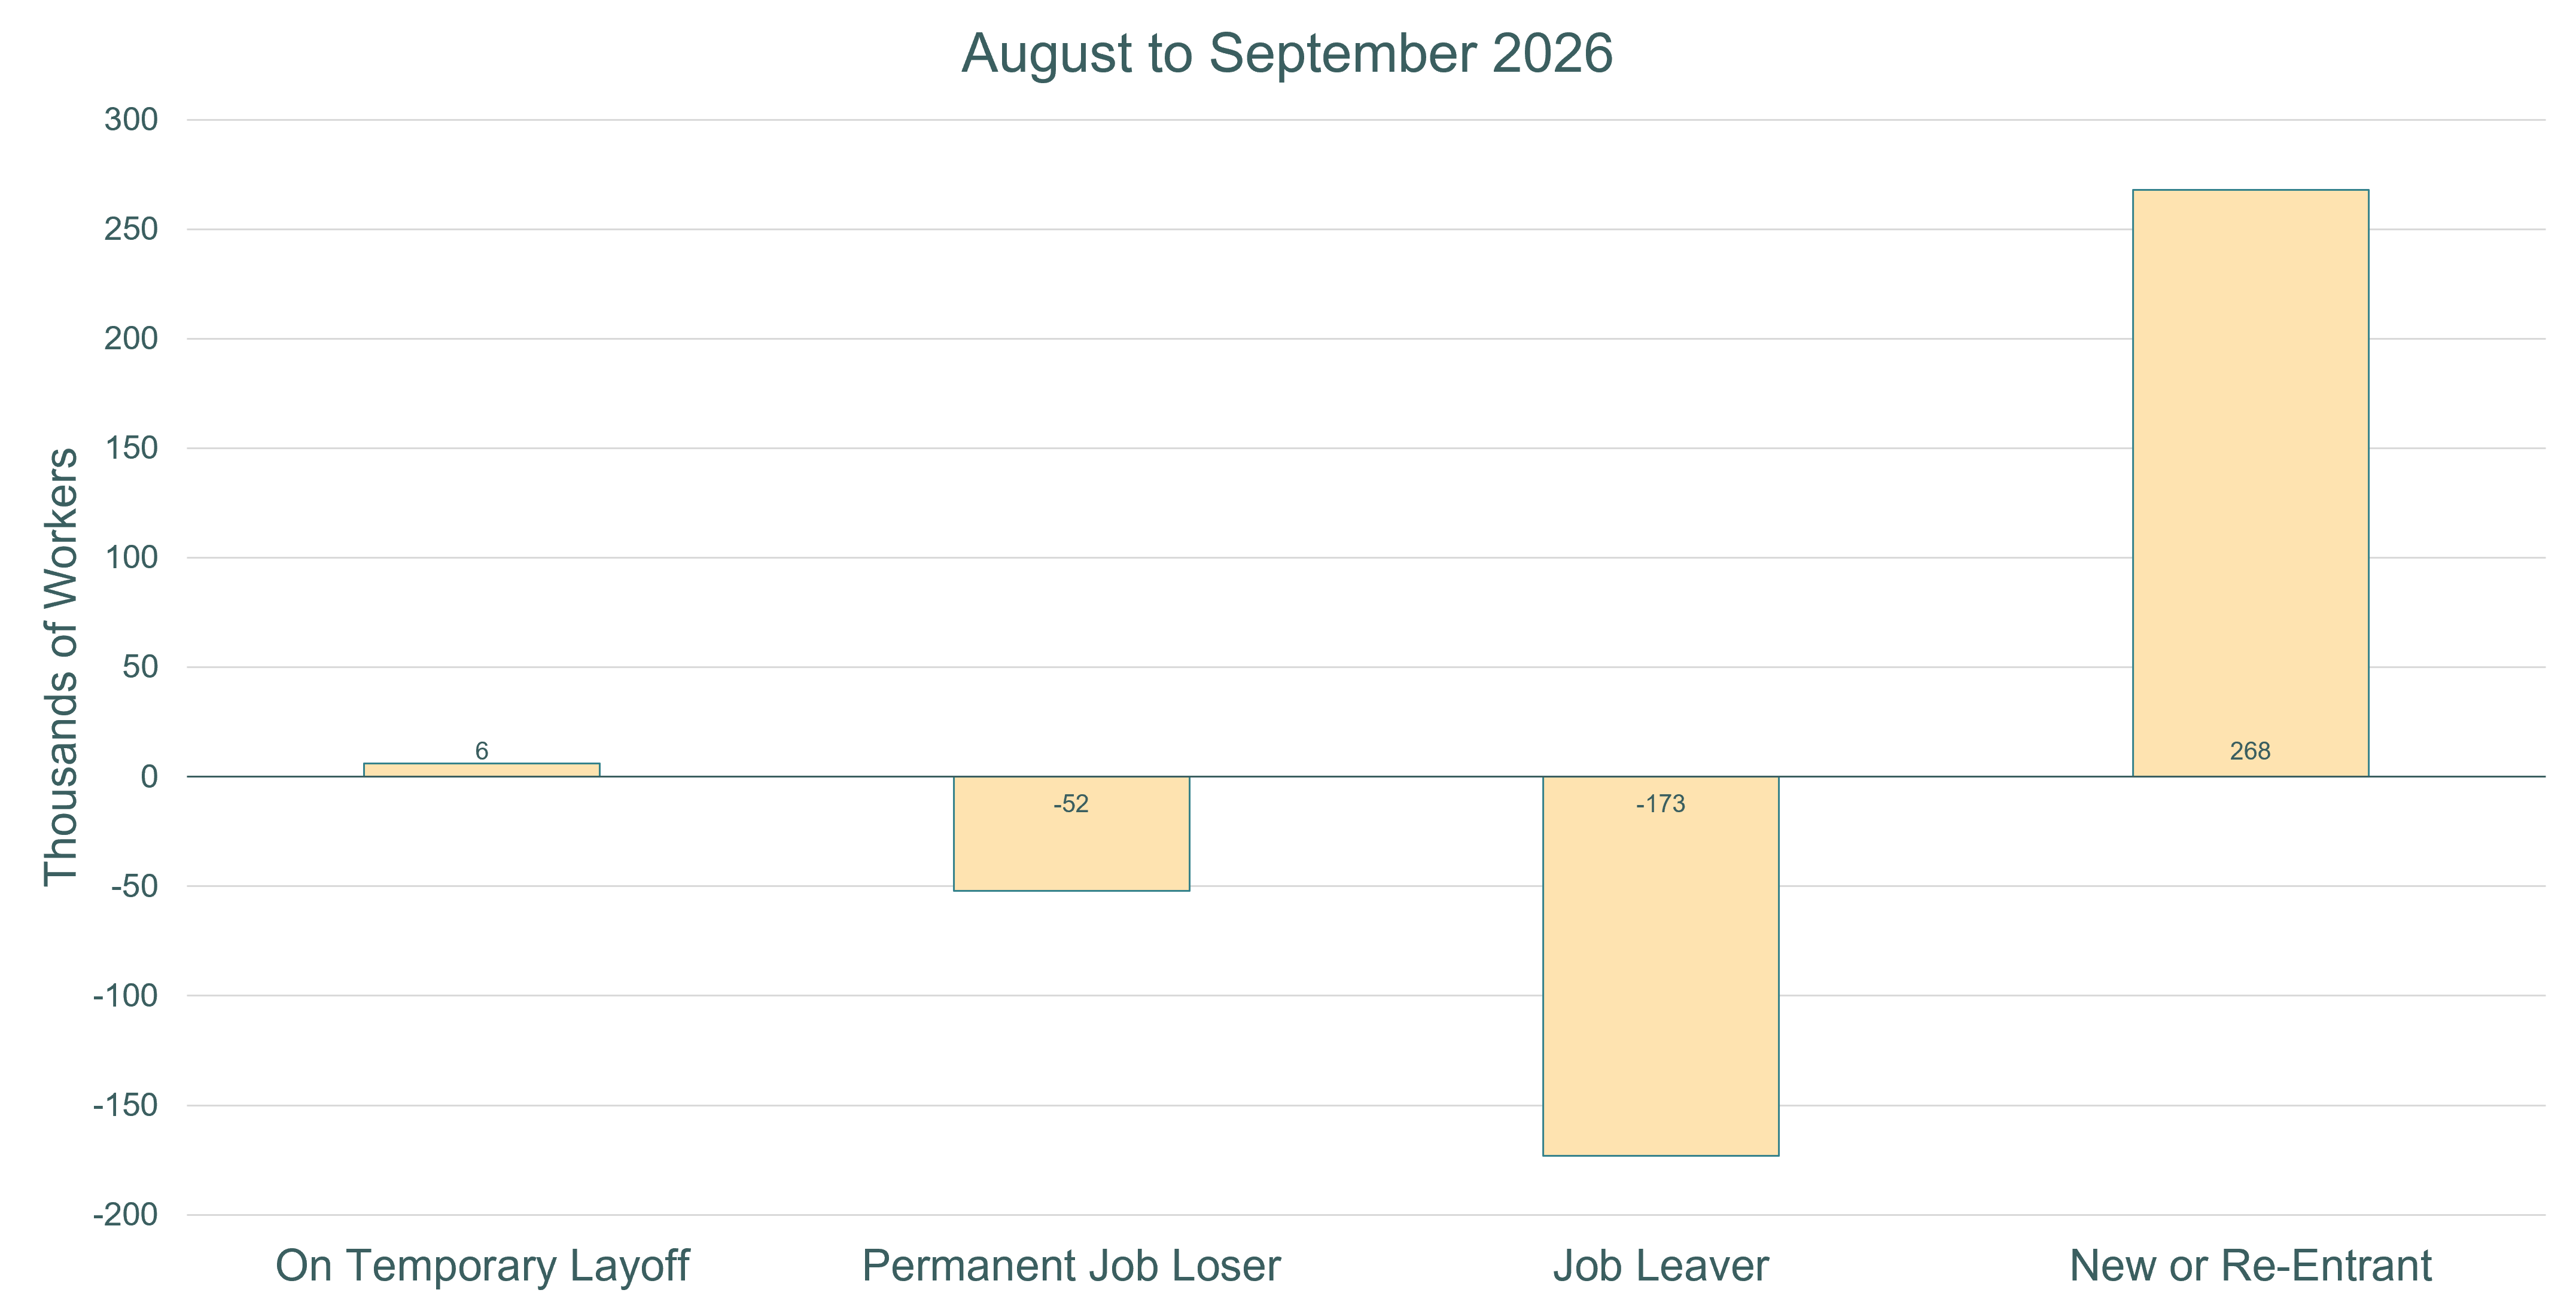
Bar chart showing change in number of workers from August to September 2026 in thousands: On Temporary Layoff increased by 6, Permanent Job Loser decreased by 52, Job Leaver decreased by 173, and New or Re-Entrant increased by 268.
Current Population Survey, U.S. Bureau of Labor Statistics (unemployment, labor force participation)

‍

The monthly FHFA purchase-only index grew by 2.6% year-over-year in July – the largest increase since August 2025.

FHFA Purchase Index, Seasonally Adjusted
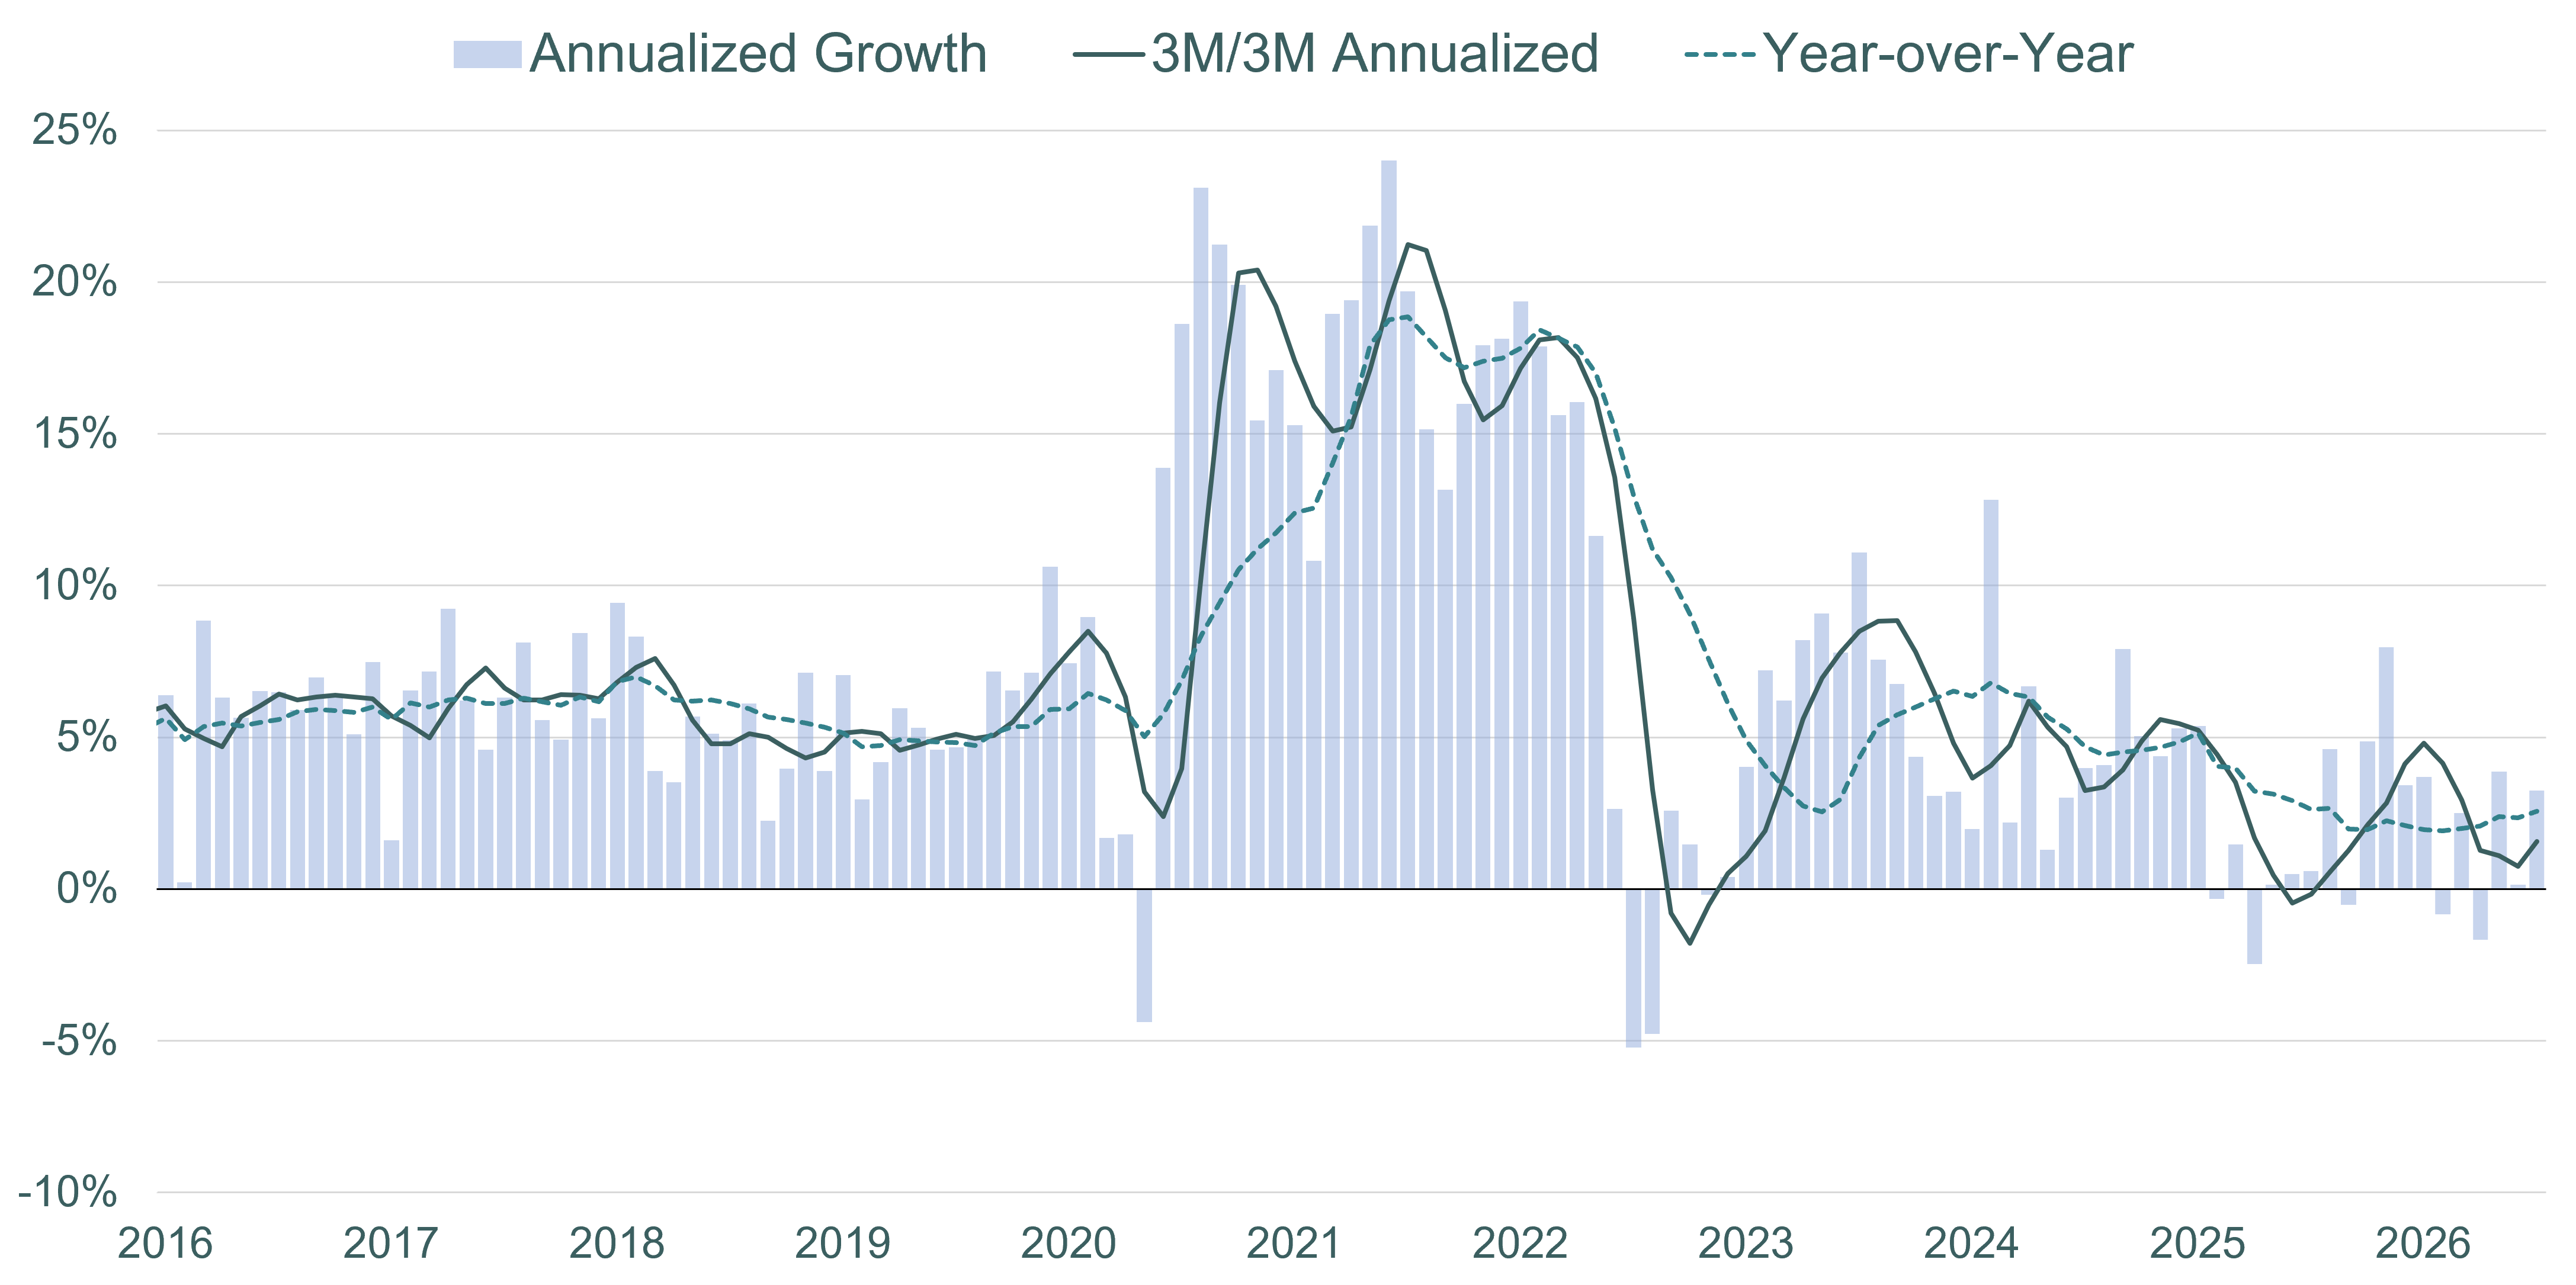
Bar and line chart showing projected annualized growth from 2016 to 2026. The blue bars represent annualized growth, with values mostly between 0% and 10% until 2020, then a sharp spike to above 20% around 2021, followed by fluctuations and a decline near 2023, stabilizing at lower levels towards 2026. The solid line shows 3-month-over-3-month annualized growth with a similar pattern. The dashed line shows year-over-year growth, following the same overall trend, peaking around 2021 and declining thereafter.
FHFA House Price Index, U.S. Federal Housing Finance Agency (national home price index)

‍

Share on Facebook
Share on LinkedIn
Embed Article
Copy
Embed Article

Get More Expert Insights Like This Right in Your Inbox

Get the best expertise and insights to help you navigate the mortgage and housing industries.

No spam, ever.  View our online privacy policy.