
Weekly Economic Update (Sept 21-25, 2026)

Download as a PDF
Embed Article
Copy
Weekly Economic Update (Sept 21-25, 2026)
Text LinkText Link
Quick snapshot of what this article covers:

Key Points

10-year Treasury yields have increased by nearly half a percentage point from the end of August.

  • Investors are pricing in higher real rates rather than higher inflation.
  • 5-year breakeven inflation - equal to the difference in yield between 5-year Treasuries and 5-year Treasury inflation protected securities (TIPS) – is around end-of-August levels.
  • This measure indicates what investors expect CPI inflation will be on average over the next 5 years.
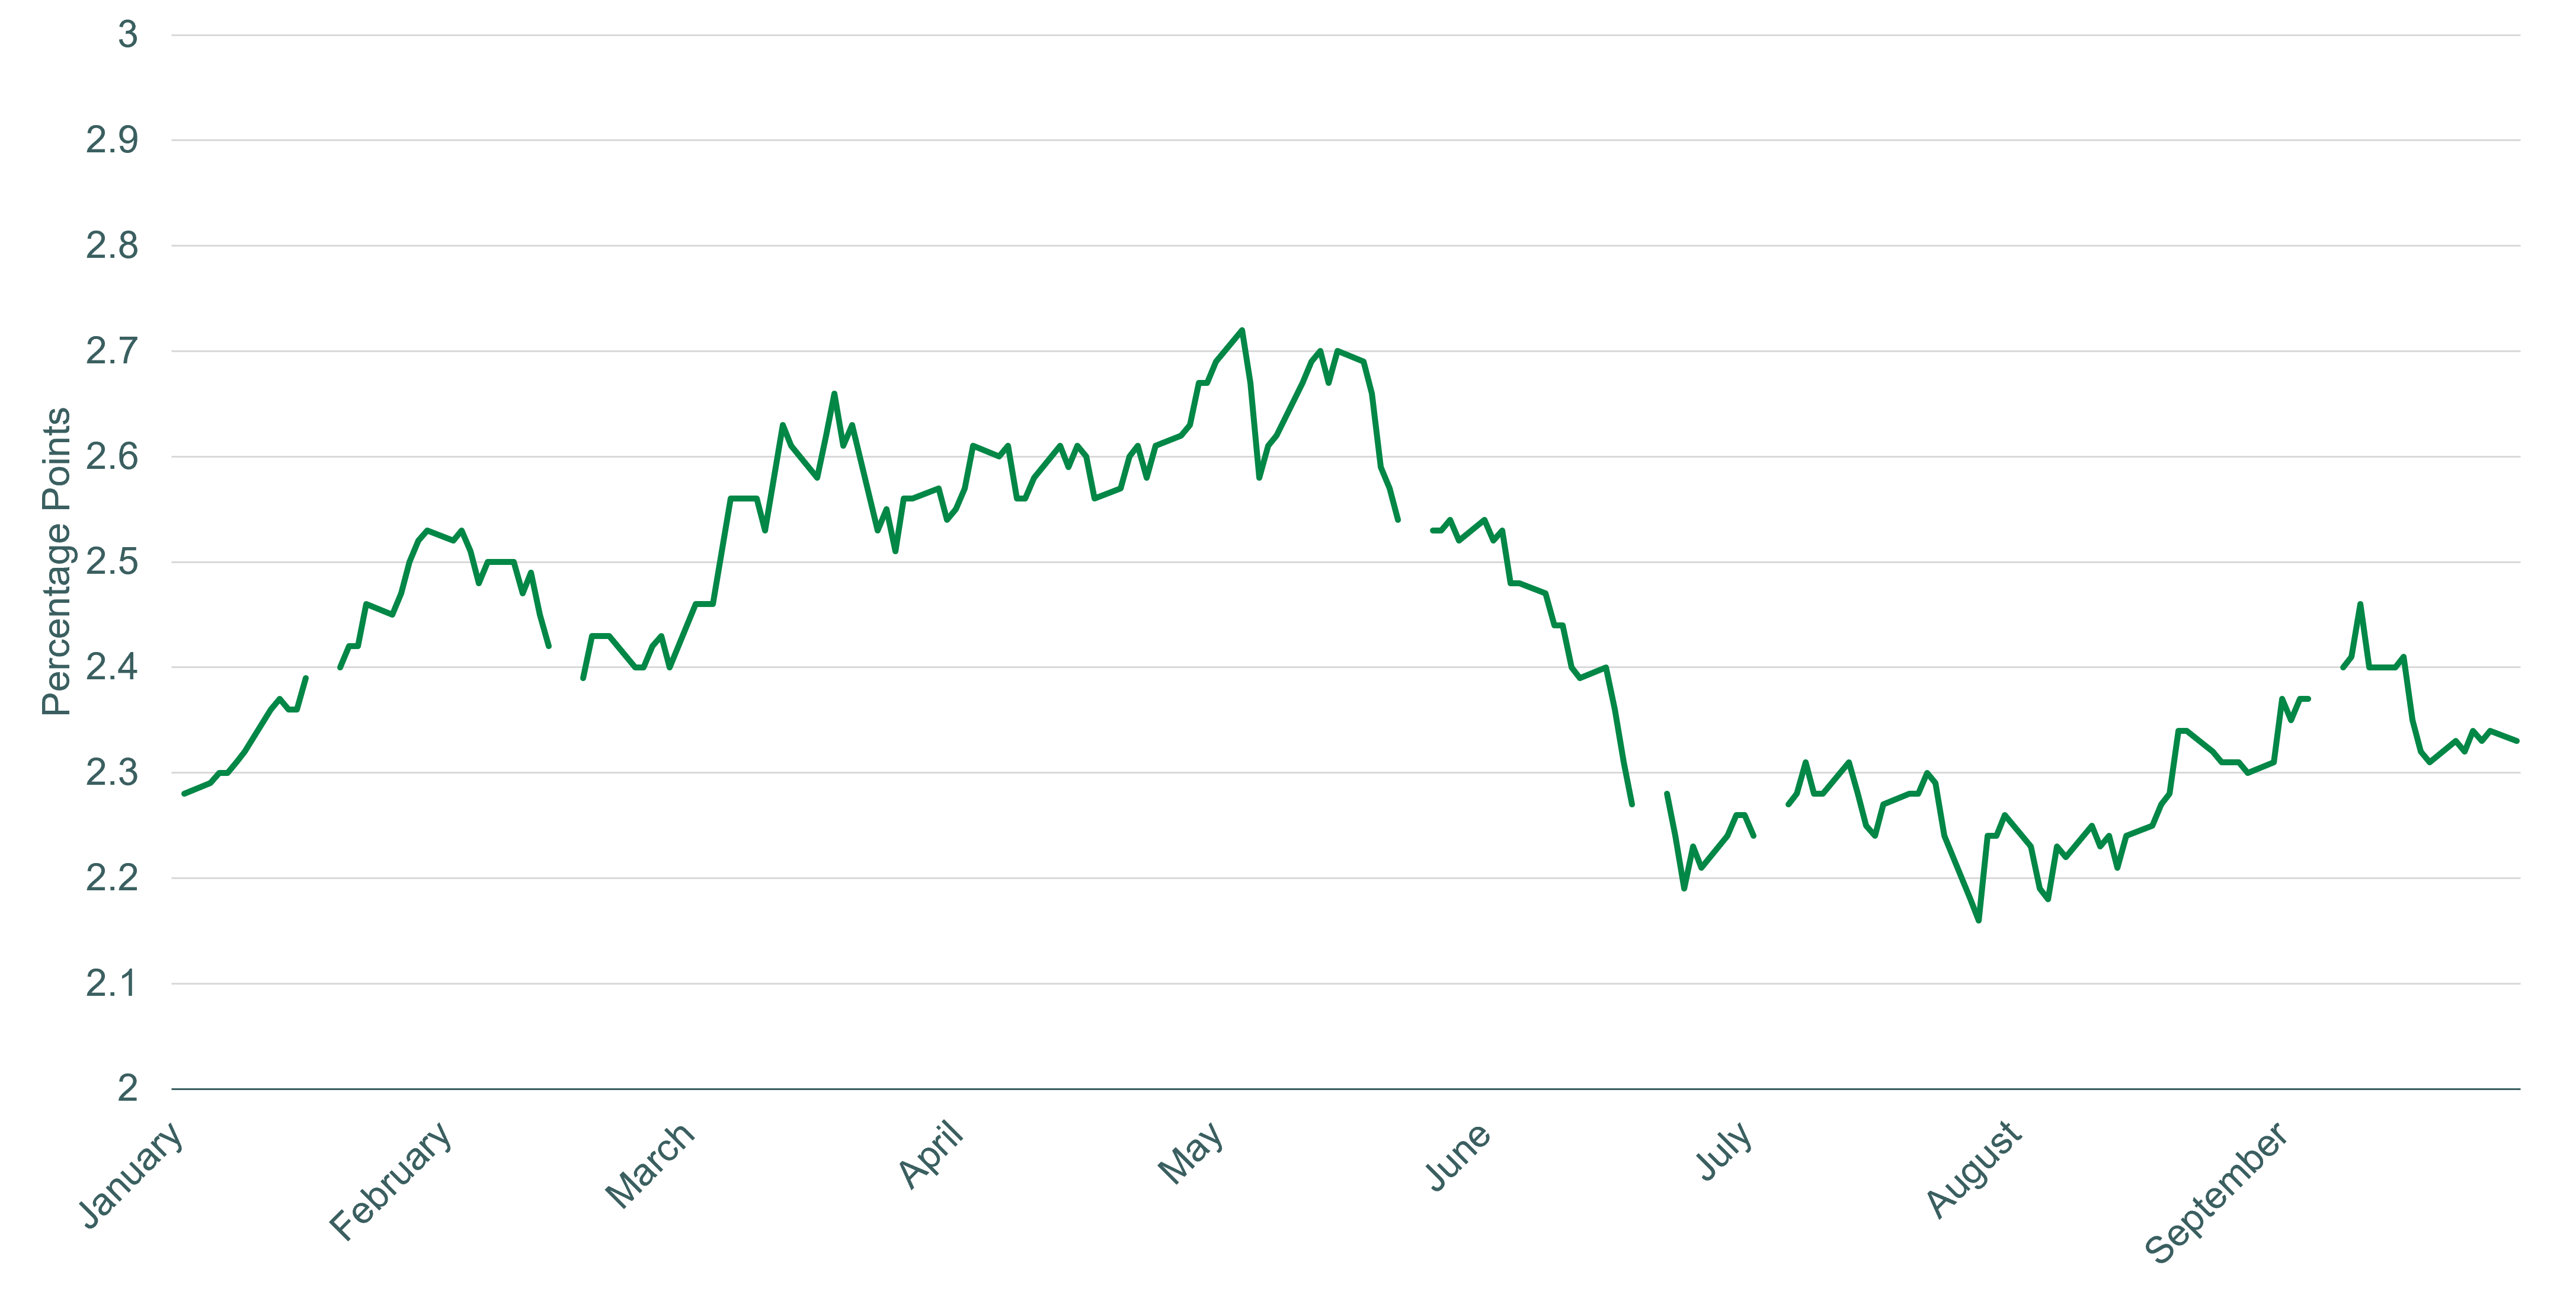
Line chart showing percentage points from January to September, fluctuating between about 2.2 and 2.7, peaking in May, then declining sharply in June, with some recovery in late summer.
Source: Board of Governors of the Federal Reserve System, Selected Interest Rates

‍

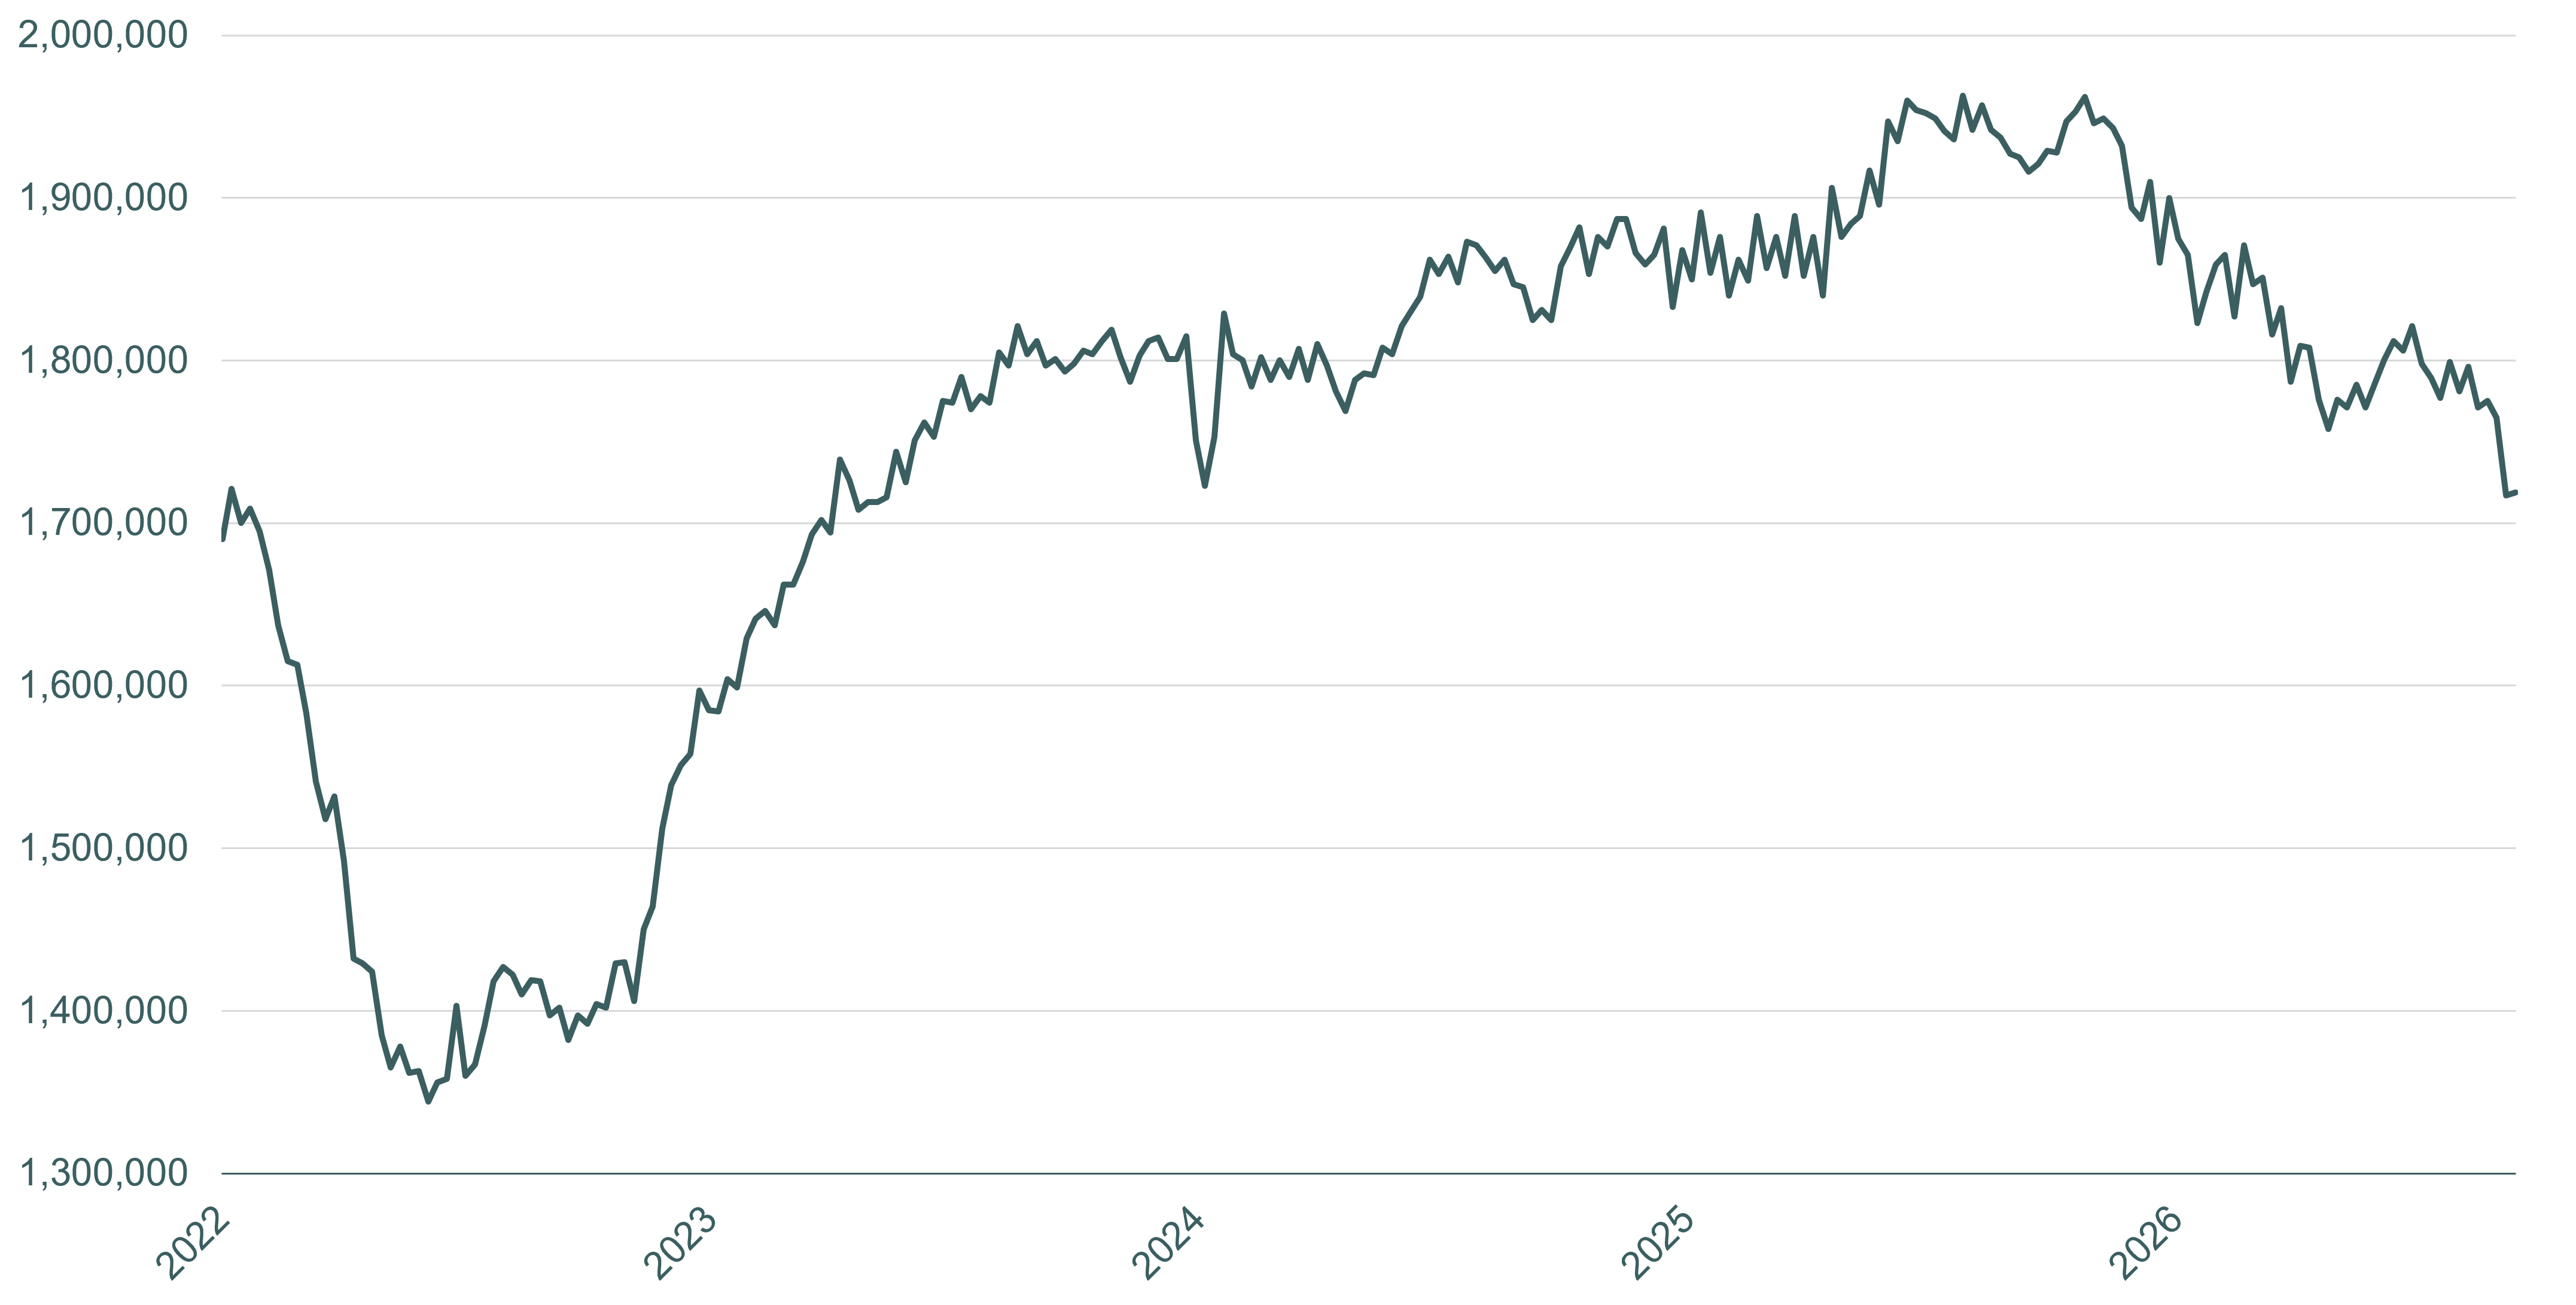
Continuing claims for unemployment insurance rose slightly though remain near the lowest levels seen since 2023.

  • Generally healthy labor market conditions paired with persistent inflation informed the Fed’s decision to raise its policy rate in September.
‍

Line chart showing the trend of unemployment insurance claims from 2022 to 2026, with values ranging from 1,300,000 to 2,000,000. The claims drop sharply in 2022 to around 1,350,000, then steadily rise through 2023, leveling around 1,800,000 in 2024, followed by fluctuations that peak near 2,000,000 before declining again in 2026.
Source: U.S. Employment and Training Administration, Unemployment Insurance Weekly Claims Report

‍

‍

Share on Facebook
Share on LinkedIn
Embed Article
Copy
Embed Article

Get More Expert Insights Like This Right in Your Inbox

Get the best expertise and insights to help you navigate the mortgage and housing industries.

No spam, ever.  View our online privacy policy.